


Customer Acquisition and Revenue Operations Benchmarks
Customer Acquisition and Revenue Operations Benchmarks
The Top Ten takeaways from our research on Customer Acquisition and Revenue Operations benchmarks
With the need to reduce customer acquisition cost, while conversion and win rates are decreasing, it’s never been more important to understand where and how to efficiently win, retain and expand customer relationships. That’s one of the primary benefits of a well-designed Revenue Operations (RevOps) function.
In the past few years, RevOps has gained traction as a business function to identify inefficiencies, boost productivity, and drive growth. Account-based (ABX) programs gained favor for similar reasons, due to their emphasis on aligning Sales, Marketing, and CS teams while increasing revenue growth.
In order to measure how Revenue Operations and ABX programs have affected revenue performance and company growth over the past year, RevOps Squared, in partnership with Demandbase, Revenue.io and Tenbound conducted benchmarking research in 2022. Here are the top ten findings from that research.
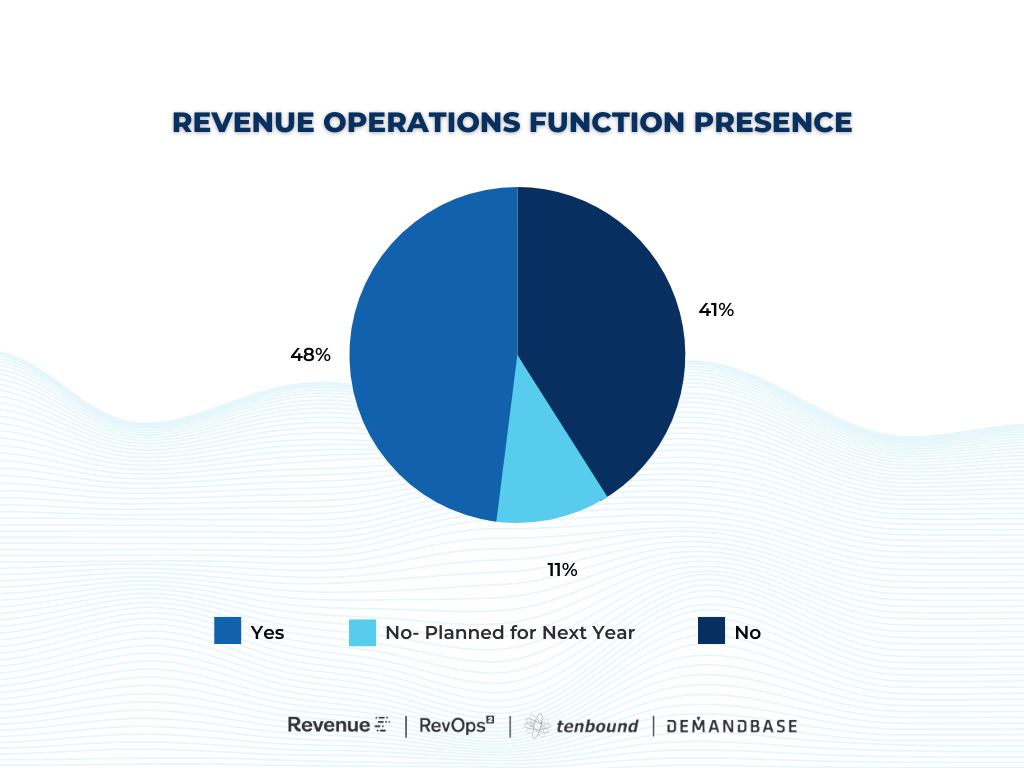
1. RevOps adoption is growing
RevOps adoption is rapidly growing, which isn’t surprising considering the potential benefits that Revenue Operations offers. Nearly half (48%) of B2B SaaS companies now have a RevOps function, up 15% over last year. An additional 11% plan to adopt RevOps within twelve months. The ROI of a Revenue Operations function, as measured by the percentage of companies who highlighted their benefits include: 1) impacting revenue growth - 13% of companies; 2) increased revenue productivity -21% of companies, and; 3) enhanced Sales and Marketing alignment - 21% of companies. Since 41% of companies participating did not have a RevOps and aren’t planning one within the next twelve months, introducing a RevOps function could give organizations a significant edge over their competitors.
2. RevOps implementation is happening earlier in a company’s evolution
If you are wondering when to introduce Revenue Operations, a good benchmark would be $5M, since that’s when the benefit of Revenue Operations first become evident. The most common phase in a company's growth to introduce a RevOps function is between $5M - $20M ARR, with the second most common being $20M - $50M ARR. Although it’s never too late to introduce Revenue Operations, establishing it early can lead to benefits that compound over time, especially at scale.
3. Regular metrics analysis sessions between Marketing and Sales is the norm
A majority of companies (54%) report having regularly scheduled "metrics analysis and planning" sessions between Marketing and Sales to review performance metrics, identify the top challenges and brainstorm on ideas to overcome the challenges. Only 15% of companies do not conduct “joint” performance metrics analysis sessions, like pipeline reviews, indicating that collaboration between Sales and Marketing teams is on the rise. If your Sales and Marketing teams are not meeting on a regular basis, it would behoove you to get your leadership in a room regularly and even consider establishing common and share goals on performance metrics such as pipeline generation, funnel conversation rates and win rates.

4. $500 Monthly Sales Tech spend per rep at $20M ARR
Just 17% of companies with less than $2.5M in ARR invest more than $500 per month in Sales Tech for each SDR or AE. But once a company hits $20M ARR, 39% of companies invest at least $500 per month. These investments in Revenue Technology are correlated with annual contract value (ACV) and company size. Company size is the number one factor determining sales technology investment.
5. CEOs are most often leading the charge to align Sales and Marketing - but is it working?
The role of aligning Sales and Marketing teams most often falls to the CEO, who is responsible for communication between these revenue generating departments at 23% of companies, making them more likely than the Head of Revenue Operations (14%), Chief Marketing Officer (15%) or CRO (13%) to have alignment duties. This may speak to the need for a senior executive with a mandate to drive closing alignment across every Go-to-Market function including Marketing, Sales and Customer Success, or at least the introduction of shared goals (metrics) that all three GTM leaders co-own.
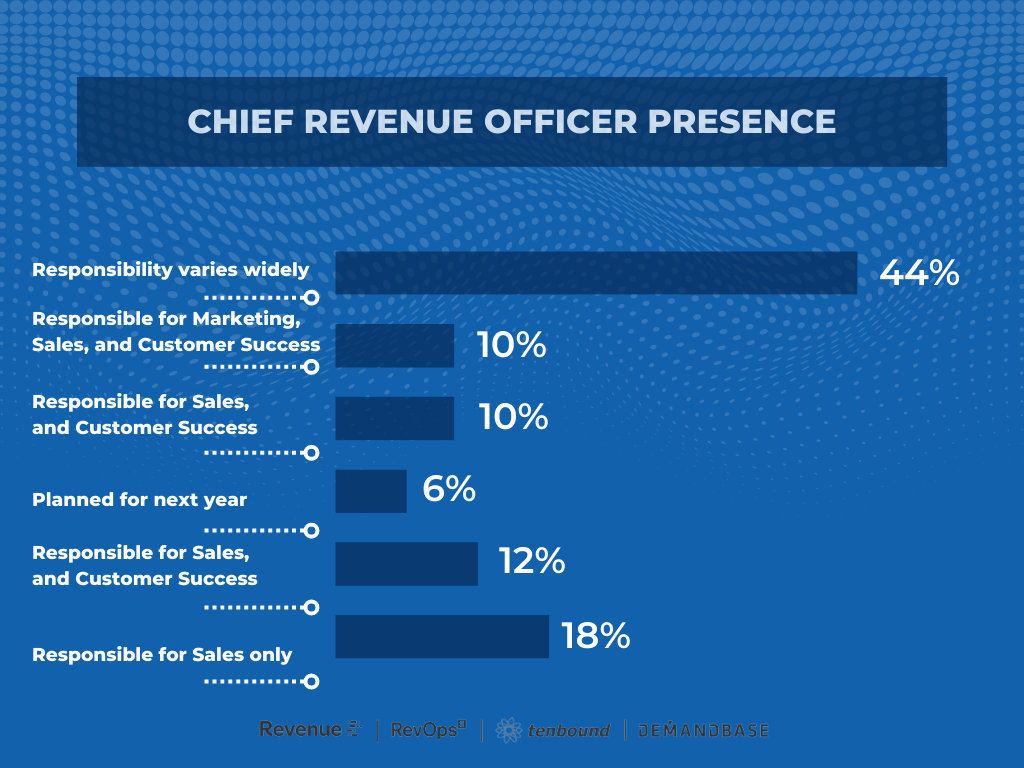
6. Almost half of companies have a CRO title - but are they really a CRO?
46% of companies have a Chief Revenue Officer (CRO), and another 10% of companies expect to add the role in the coming year. However, the title doesn't always correlate to stronger Revenue Operations, due to the wide number of ways the role is interpreted. For example, just 10% of CROs are responsible for Sales, Marketing and Customer Success. The Chief Revenue Officer often has a primary responsibility to align and integrate all revenue team functions, but not giving them direct leadership of the revenue-generating teams risks creating a lack of alignment and an inconsistent customer experience across Customer Acquisition, Retention and Expansion.
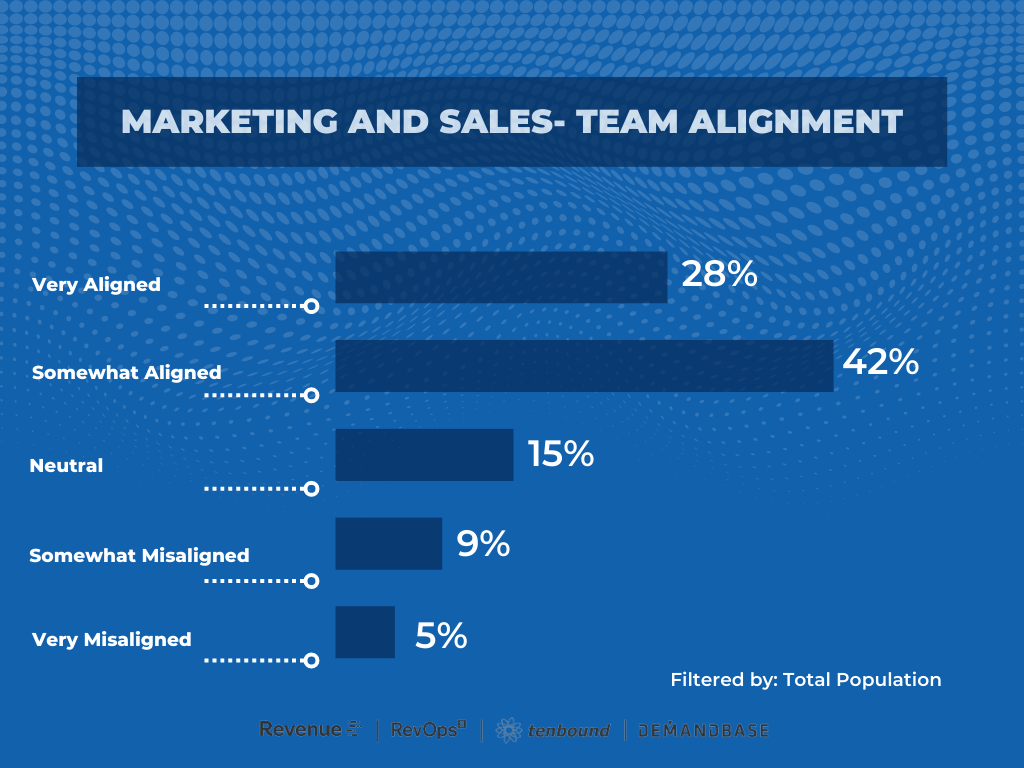
7. Marketing and Sales are very aligned 28% of the time
Alignment between Sales and Marketing teams is reported as “very aligned” in 28% of companies. The majority of companies (42%) report they are somewhat aligned, while 29% report a neutral or not aligned status. Many companies struggle with Sales and Marketing alignment most during those times when company goals are not being meet, and focus in increased on “department goals” versus the overall company goals. Research reveals that an increased emphasis on shared goals, regular joint analysis sessions, and executing the action items that come from the analysis session would go a long way to improve alignment and revenue growth performance.
8. The largest percentage of SDR teams contribute 21% - 30% of Pipeline and New ARR
Interestingly, when we look at the relationship between pipeline contribution and new ARR from outbound SDR activity, the sweet spot lies between 21% - 30% of pipeline. The correlation of pipeline contribution to New ARR contribution actually decreases when SDR pipeline contribution increases above 30%. One way to measure the actual ROI of SDR investment beyond meetings, opportunities, and even New ARR is to also understand the pipeline coverage ratio associated with pipeline generated by SDR outbound activity…this may also highlight if diminishing returns exist in your company when relying too much on SDR activity. A combination of dark funnel generating “demand” via social media engagement, content engagement, and account-based programs leading to increased inbound lead flow may ultimately have a higher return as measured by New ARR and Customer Acquisition Cost efficiency.
9. Inbound Marketing leads contributes less than 30% at pipeline at more than half of companies
Even though significant resources are invested in attempting to measure marketing attribution, the data is telling. 52% of companies report inbound marketing leads represent less than 30% of qualified pipeline, with 39% reporting less than 20% of qualified pipeline comes from inbound marketing leads
In summary, metrics and benchmarks alone can make for interesting reading, but the real value is when a company understand the leading indicators and signals being generated across the customer journey. And then having the process and collaborative culture of alignment across the Marketing, Sales, Customer Success and Revenue Operations teams, which often can begin with creating a foundation of shared goals, measurements and understanding of which metrics really matter.
Learn more:
Thanks for reading! To see all the Customer Acquisition and Revenue Operations benchmarks from this research, click here to see how they measure up to your company.