


How to Make Go-To-Market Metrics Actionable with Context
How to Make Go-To-Market Metrics Actionable with Context
Go-to-market metrics with Scott Stouffer, Founder and CEO of scaleMatters
How does context inform metrics? In a conversation from the SaaS Metrics Palooza 2022, Scott Stouffer, Founder and CEO of scaleMatters, explains how to make go-to-market metrics actionable with context.
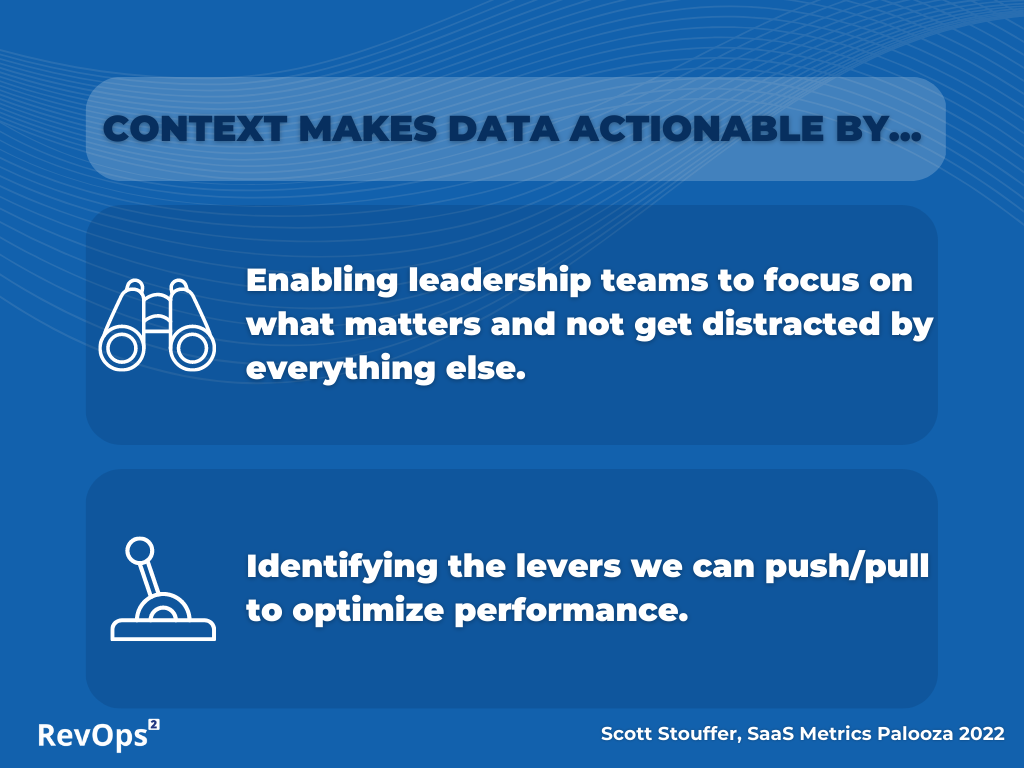
Despite the available data and information available to leadership teams, decision making is often based on intuition and speculation. Scott argues that context is what turns data into actionable information and provides five contextual elements to consider when evaluating data: 1) plan; 2) time element; 3) causality; 4)significance and; 5) industry benchmarks. He also spotlights the importance of properly configuring and instrumenting the revenue tech stack to ensure the proper data flow. Let’s dive into the contextual metrics elements that Scott highlights.
Plan as Context:
When evaluating results data, it is essential to consider how the actual results compare to your plan. Your plan should include details on what you expect to happen and the underlying assumptions. Scott explains that this can help identify where the friction and inefficiencies lie and uses conversion rates to demonstrate this idea. It can be challenging to spot actionable trends from the data points by looking at several conversion rate charts. But, overlaying planned performance rates can show where your team is falling short and identify those specific areas to analyze and create action plans to address the gaps in actual performance against planned performance.
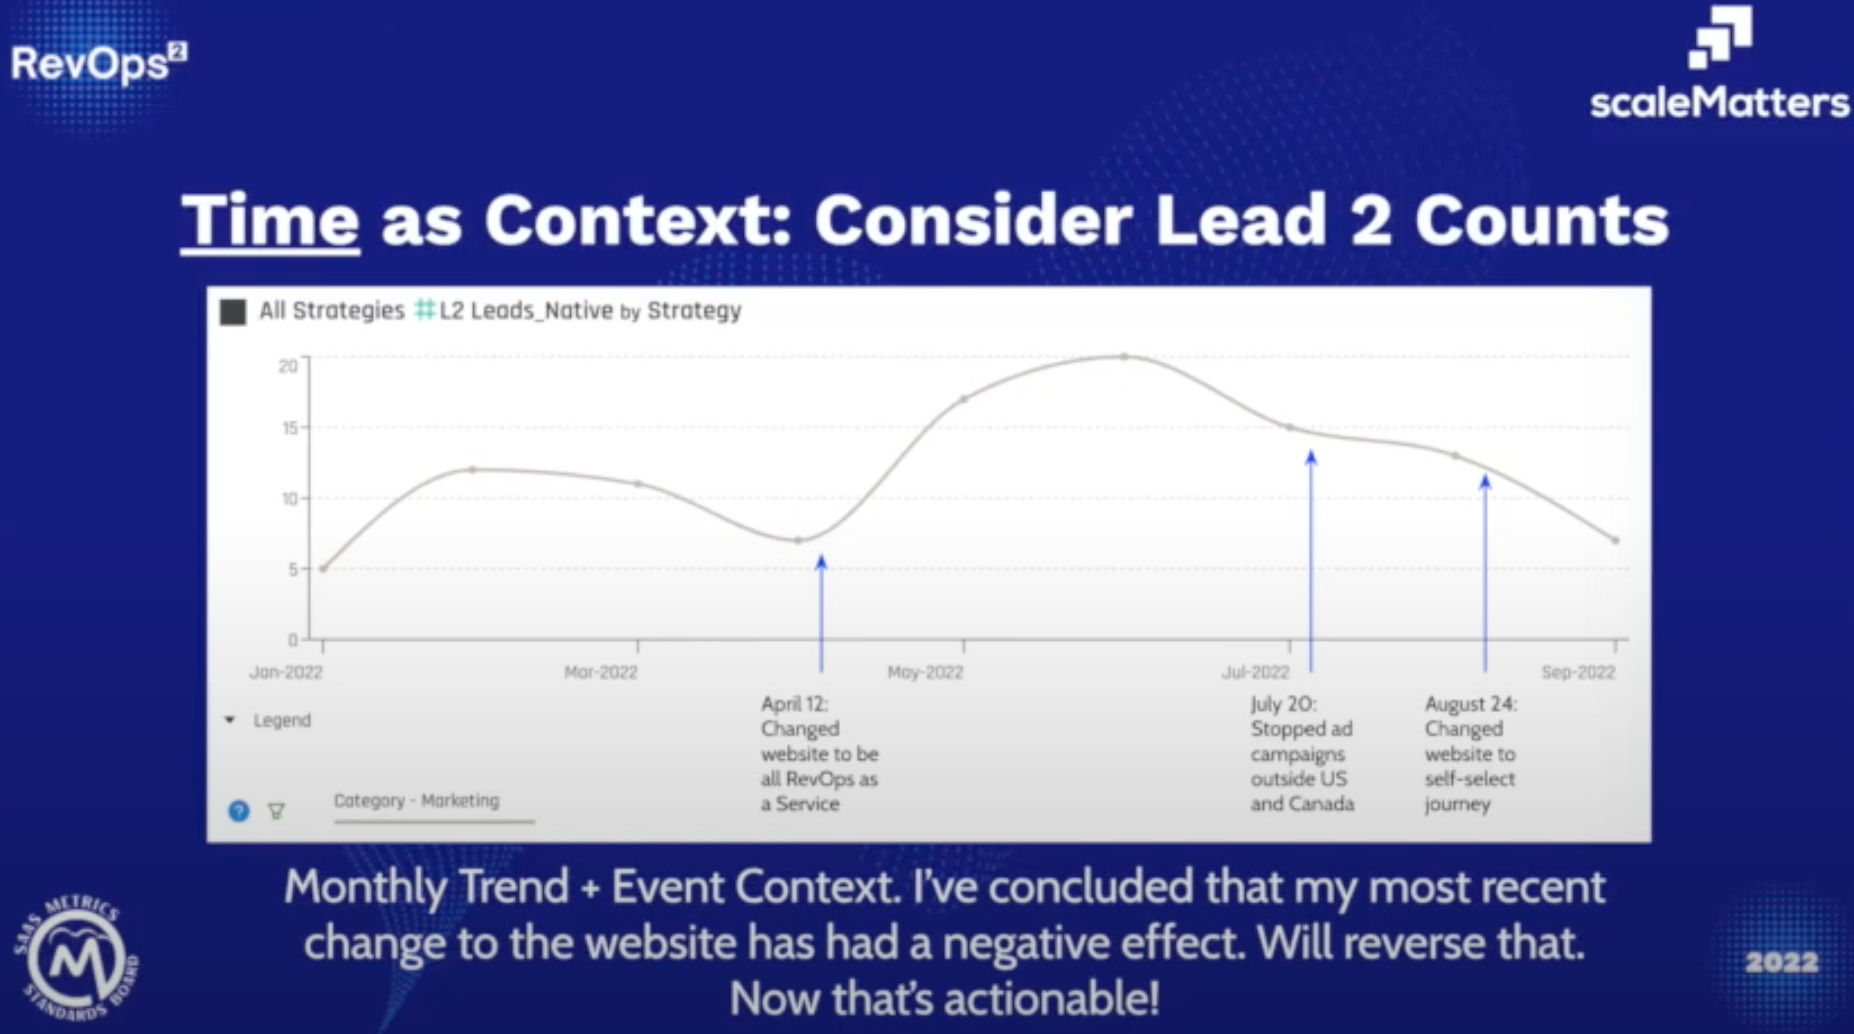
Time as Context:
Time is a contextual element that has three components: Period-over-Period, Trends, and Triggers/Events. Scott highlights that the time element helps to understand the velocity of change. Adding event context to a monthly trend graph can point to specific instances that change the project’s trajectory. By looking at the context of relative significance, it will become more apparent which strategies have positive and negative effects.
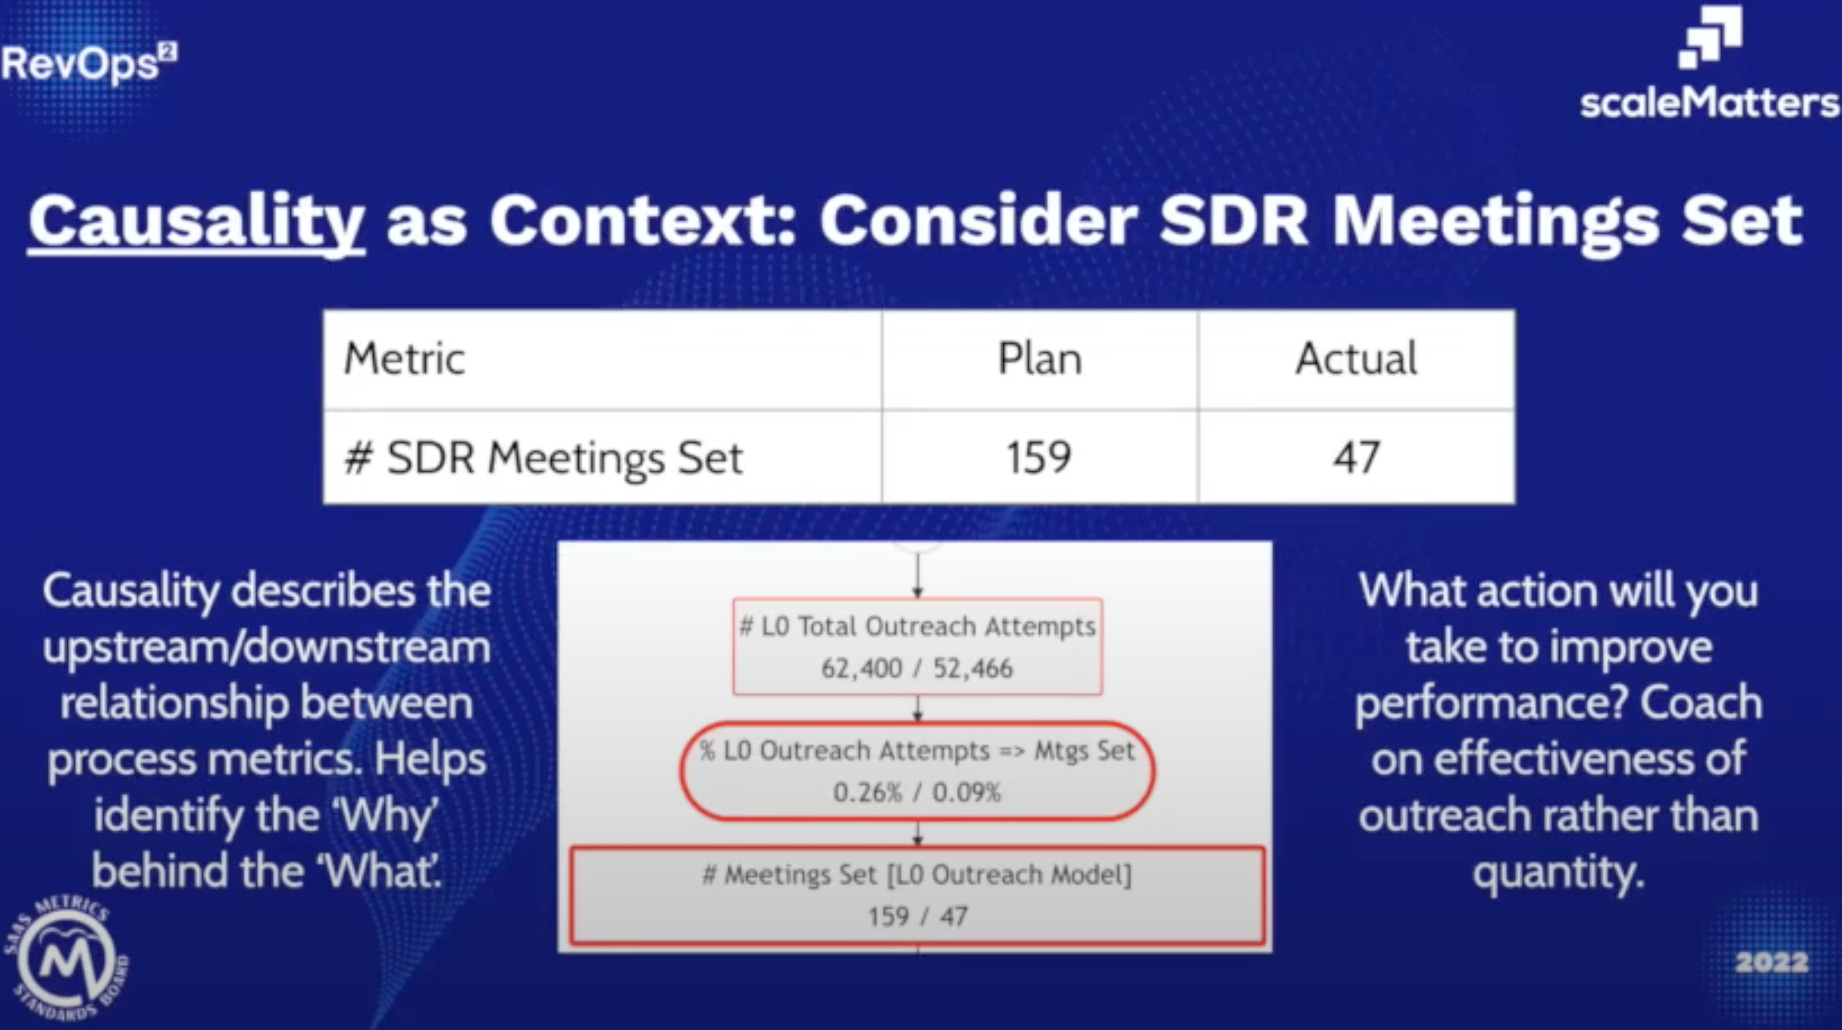
Causality as Context:
Causality helps to understand the degree of a relationship between input signals and the associated outcome. It helps to prioritize focus and attention on the inputs that might be causing a derivative impact on the outcome metric(s) - “causality exists so you can treat the cause rather than the symptom.” Scott provides an example of SDR outreach that shows outreach attempts being 16% behind plan and the effectiveness measurement being 65% behind plan. In this case, the focus needs to be on improving the overall effectiveness of the outreach rather than asking the SDRs to increase their number of calls.
Significance as Context:
Significance is a way to add weighting to metrics in order to “separate the signal from the noise” to guide us on where leaders should focus attention. Scott provides an example of actual versus planned year-to-date performance for a sourcing strategy. He explains that by looking at the context of relative significance, it is clear that the prospecting SDR strategy is by far the worst-performing strategy, followed by the LinkedIn ads strategy. Significance helps on how to prioritize these issues. In this case, Scott would suggest reforming the SDR strategy before tackling the issue with advertisement.
Industry Benchmarks as Context:
Scott explains that industry benchmarks are invaluable for understanding what good, better, best, and bad look like. He provides an example of average monthly meetings set by SDRs. He explains that by adding an industry benchmark from a relevant cohort, it is clear that nobody is doing particularly well and that the team average is less than half measured against the relevant company cohort. It is important to note that industry benchmarks are only helpful if the sample size is large enough to be able to form relevant cohorts that line up well with your company’s characteristics. Otherwise, it’s an apples to oranges comparison and can likely lead to bad decisions.

Tech Stack
It is important to properly configure and instrument the revenue tech stack to generate the necessary data and reports to analyze the bottlenecks and signals that are negatively impacting the outcome metrics. Scott highlights that many companies do not properly connect the marketing automation platform to the CRM, which leads to a lack of visibility into how leads and marketing qualified leads (MQLs) convert into qualified opportunities. He explains that it is important to have someone who is skilled in the configuration of the tech stack and who understands data schemas and data models.
Conclusion
Scott believes that context is what turns data into actionable information. He provides the five contextual elements to consider when evaluating data: 1) versus plan; 2) time element; 3) causality; 4) significance and; 5) Industry Benchmarks.
If you would like to watch Scott Stouffer’s presentation at SaaS Metrics Palooza, you can find it here. If you prefer to listen to my conversation with Scott on the Metrics that Measure Up podcast, click here.
Thank you for subscribing to the Metrics that Measure Up Newsletter. If you are not subscribed, be sure to click here to add your name to our mailing list below!