


Revenue Performance Metrics versus Sales Management Metrics
Revenue Performance Metrics versus Sales Management Metrics
Have you ever been confused about the difference between a Chief Revenue Officer and a Senior Sales Executive? The answer may reside in the metrics they talk about and use!!!
In recent RevOps Squared benchmarking research, 54% of companies reported they have a “CRO” title in their company. The responsibilities of an executive with the Chief Revenue Officer (CRO) title were:
Sales Only: 39%
Sales and Marketing: 26%
Sales and Customer Success: 13%
Sales, Marketing, Customer Success: 22%
How do you know if you have an executive, especially an existing Sales executive that thinks like a CRO versus a Sales executive? One good place to start is understanding the revenue growth performance metrics they think are important to measure the performance across Customer Acquisition, Customer Retention, and Customer Expansion.
Let’s start with the metrics a more traditional “Sales Executive” use in managing their organization and are most comfortable with:
Sales Management Performance Metrics:
Sales Development:
Qualified Pipeline (%) generated
Closed-Won ARR ($)
Conversation rate to meetings scheduled
Meetings scheduled to meetings held (%)
Qualified lead to qualified opportunity (if you use qualified leads)
Quota Achievement
Direct Sales:
Closed-Won ($) - New and Expansion ARR
Closed-Won (%) - Qualified opportunity to Closed-Won
Average ACV
Sales Cycle Length (qualified stage to closed-won)
% Closed-Won from self-directed pipeline development
Quota Achievement
Sales Management:
Closed-Won ($) - New and Expansion ARR
Closed-Won (%) - Qualified opportunity to Closed-Won
Actuals versus Plan
Actuals versus Quota Assignment
Average ACV
Sales Cycle Time
Pipeline Coverage Ratio
Forecast accuracy - timing+amount (be within +/-5% every quarter)
Each of the above “Sales centric” performance metrics directly impacts below “Revenue Performance” metrics that a CRO will instrument, use to inform decision making and measure their performance.
More importantly, a CRO will understand the impact of Sales, Marketing, and Customer Success specific leading indicator metrics on the below Revenue Performance Metrics Framework.
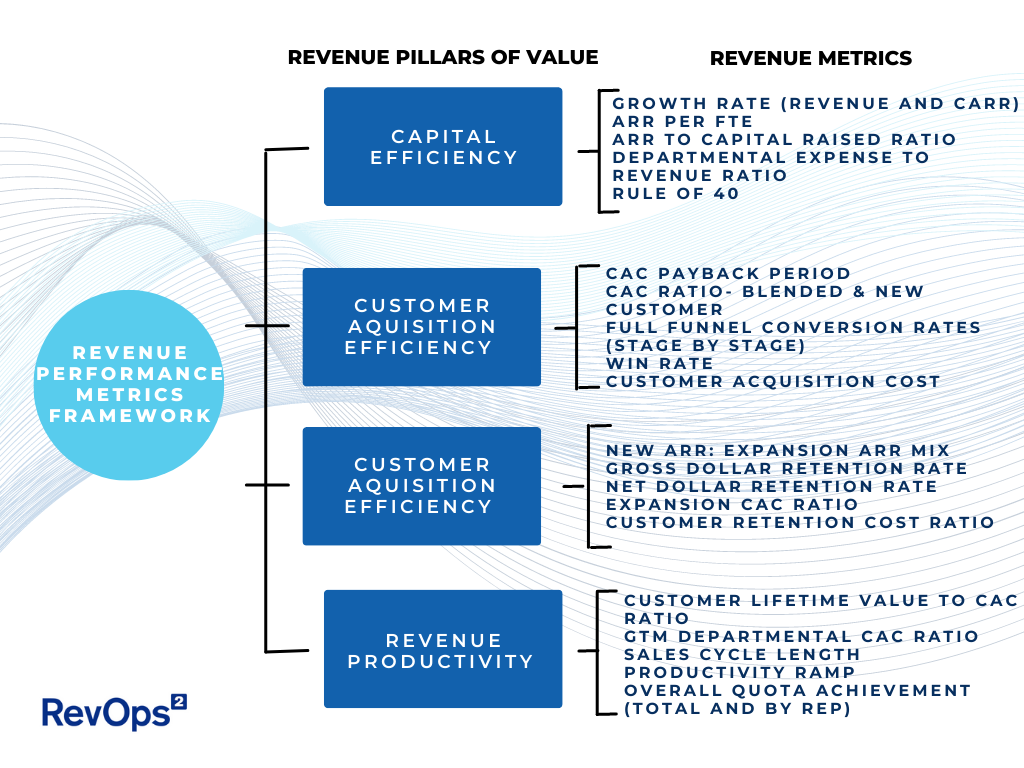
Revenue Leadership Performance Metrics Framework:
When to introduce each Revenue Performance Metric?
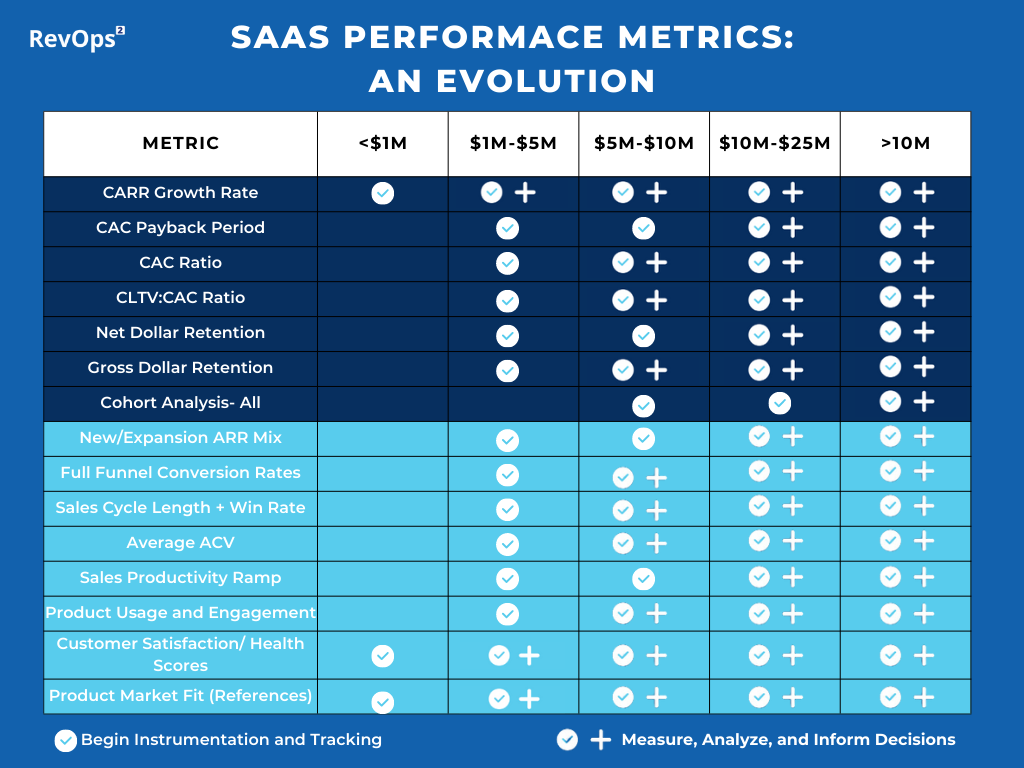
What are the top SaaS performance metrics to measure the efficiency of revenue growth and how do those metrics evolve as a company grows from $1M to $10M to $25M to $50M ARR and greater?
As part of the above RevOps Squared SaaS Performance Metrics Framework, we include the “Revenue Performance Metrics” we recommend at each stage of growth using the simple categorization:
Measure and Use: those performance metrics should be a primary source of insights for decision making including when to increase investment in customer acquisition.
Instrument and Understand: those performance metrics that should be instrumented, calculated, and analyzed to help inform the potential for increased investment to reach the next stage of growth...or the need to fix before increasing investment.
Revenue Performance Metrics to use - by Company Size:
<1M ARR
Establishing Product Market Fit is priority #1
% of customers who are retained and referenceable
CARR and ARR growth rate
$1M-$5M
Measure and Use:
CARR and ARR Growth Rate
Logo Retention
Instrument and Understand:
CAC Payback Period
New CAC Ratio
Gross Dollar Retention
Net Dollar Retention
CLTV:CAC Ratio
$5M-$25M
Measure and Use:
CARR and ARR Growth Rate
CAC Payback Period
New, Blended and Expansion CAC Ratio
Logo Retention
Gross Dollar Retention
Net Dollar Retention
CLTV:CAC Ratio
Instrument and Understand:
Cohort analysis of all of the above
>$25M
Measure and Use:
CARR and ARR Growth Rate
CAC Payback Period
New, Blended, and Expansion CAC Ratio
Logo Retention
Gross Dollar Retention
Net Dollar Retention
CLTV:CAC
Cohort analysis of all above
The above table does not include all the "leading indicators" or “departmental metrics” that directly impact the top level revenue performance metrics (lagging indicators).
Examples of leading indicators (metrics) across the customer journey including the customer acquisition, customer expansion, and customer retention processes include: activity conversion rate, win rate, average contract value, sales cycle length, stage by stage conversion rates, win rate, renewal rate, product utilization, customer satisfaction, customer health score, net promoter score, pipeline generated, pipeline coverage ratio, etc.
In developing any performance metrics, identify those operational and departmental metrics that directly impact these company level revenue performance metrics. This is a critical step in building a holistic Performance Metrics framework so that everyone in the company can understand how their individual objectives impact next level metrics.
The above “Revenue Performance Metrics” do not include Capital Efficiency and Operating Efficiency metrics such as Rule of 40, Gross Margin, ARR: Capital Raised, Burn Multiple, ARR:FTE, etc. Actuals vs Plan is a Revenue Performance Measurement that should be measured at every stage of growth - I just do not consider it a metric...but is essential.
Revenue Performance metrics are the hallmark of a world class CRO, as they typically have the highest causal relationship durable, efficient revenue growth and thus impact on enterprise value creation. They also span across customer acquisition, customer retention, and customer expansion which is the trifecta to optimize and maximize revenue growth and customer satisfaction across the customer lifecycle
Sales metrics are tried and true, and are the foundation for any company looking to understand the efficiency of their sales organization, and what areas of the sales process are performing well or need improving.
The “performance metrics” of a CRO versus a head of Sales are two very different vocabularies, and the performance metrics are at the center of the difference in profile and foundational to company performance that matters to investors and the board.